Multi-dimensional Reporting
A publisher's traffic is almost always distributed across various countries and channels. The current digital media landscape also demands that multiple revenue streams are used to maximize ad revenue, therefore contributing revenue from multiple sources as well.
To effectively analyze performance and understand it, publishers need the ability to drill-down and see how they are performing across these various dimensions. For example, understanding which country is generating the most revenue, which traffic channel displays the highest engagement metrics, and which article is bringing in the most money is invaluable information that facilitates a profound understanding of performance with the insight to support decision making.
Collecting this information across all the revenue streams and different data providers publishers use is not easy. It requires a high degree of data instrumentation and extrapolation.
Regardless of the challenges, Marfeel does this for publishers in Insight. We collect massive data sets and then enrich them by normalizing them, so publishers can read the numbers the right way.
Several filters are available to accurately inspect multiple dimensions of a publisher's engagement and revenue metrics for a much clearer understanding of performance.

Dimensions
The primary dimension filters in Insight provide a range of categories to filter the metrics on the Reporting page by.
By default, the primary dimension is set to Tenant URI, meaning that the metrics for all tenants in a publisher's media group will be displayed; the individual tenants themselves are listed below in the tenants list section.
Publishers can then apply a secondary dimension to drill down further into the metrics displayed. To apply a secondary dimension:
- Click +Add filter.
- Select Secondary Dimension.
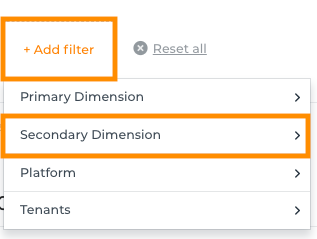
- Select the dimension you want to filter by and then click Apply.
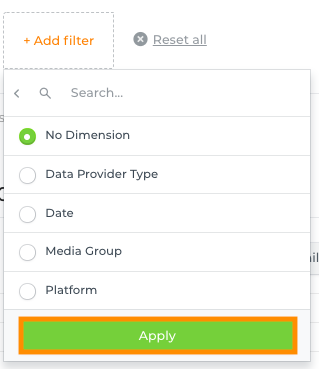
The dimensions available are:
Date
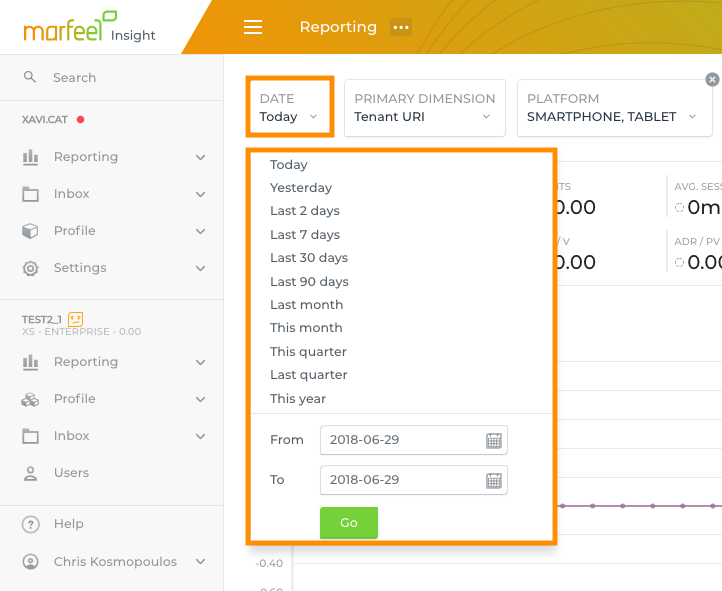
By default, all the metrics shown on the Reporting page is for the current day's figures.
You can also apply a time filter to measure your Marfeel mobile site's KPIs over a defined time period to account for variance and fluctuations.
To apply a time filter:
- Click the Date field.
- Select one of the pre-determined filters displayed or enter the time period you want to define by clicking the calendar icons in the From and To fields and selecting your dates of interest.
- Click Go to apply the time filter you've selected.
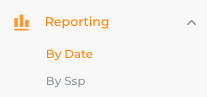
You can also use the By Date shortcut by expanding the Reporting menu in the side panel.
Tenant URI
Filtering by Tenant URI will display all tenants in your media group and their metrics in the Tenants list section, regardless of the secondary features applied.
To filter by tenant URI:
- Click Primary Dimension.
- Select Tenant URI and then click Apply.
Tenant
If publishers have more than one tenant in their media group, they can select a specific tenant, or a combination of them, to display metrics for.
By default, all tenant analytics and revenue KPIs are aggregated on the Reporting page when you log in to Insight.
To filter by tenant:
- Click +Add filter.
- Select Secondary Dimension.
- Select Tenants.
- Select the tenants you want to display engagement and revenue metrics for and then click Apply. There is also a search bar, in addition to a Select All and Unselect All option.
Data provider type
By default, the metrics from all revenue streams and data providers that a publisher uses are displayed in the Reporting page.
To see metrics from each revenue stream used:
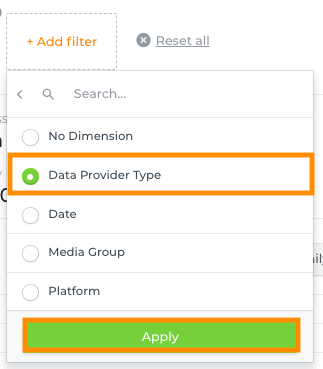
- Click +Add filter.
- Select Secondary Dimension.
- Select Data Provider Type and then click Apply.
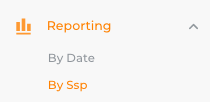
You can also use the By SSP shortcut by expanding the Reporting menu in the side panel.
Media group
For publishers that have multiple media groups associated with Marfeel, they can also filter based on those media groups:
- Click +Add filter.
- Select Secondary Dimension.
- Select Media Group and then click Apply.
Platform
By default, the metrics displayed on the Reporting page are for all the traffic on the platforms the publisher has Marfeelized.
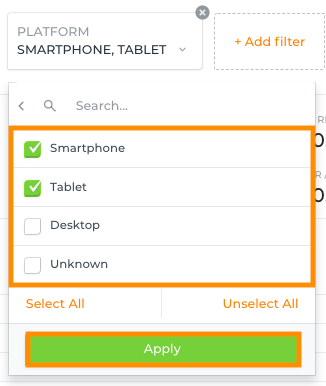
To filter by a specific platform or a combination of them:
- Click +Add filter.
- Select Secondary Dimension.
- Click Platform.
- Select the platforms your want to
- Select Media Group and then click Apply.
Channel
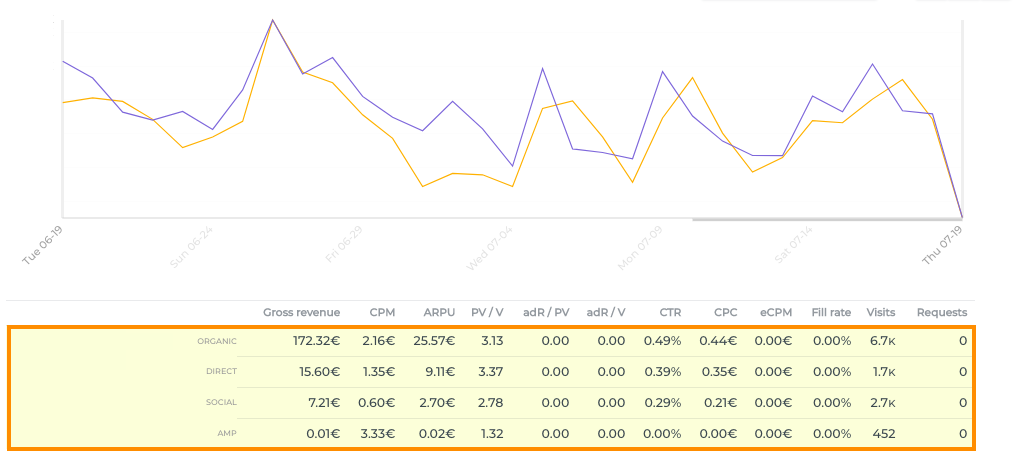
In Insight, publishers can also drill-down into their revenue and engagement metrics according to traffic channels they use for unparalleled visibility on their performance to empower their decision making.
To filter metrics based on channel:
- Click +Add filter.
- Select Secondary Dimension.
- Select Channel and then click Apply.
- Hover over the metrics below the time series to see your metrics breakdown based on channel. Channels are displayed by descending order of revenue generated.
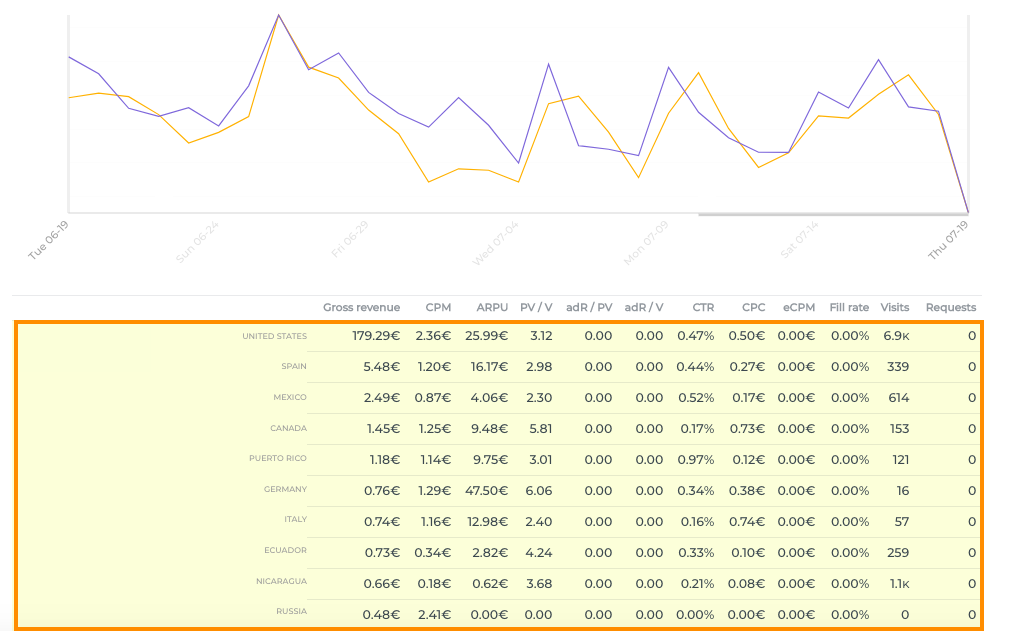
Geo
To filter based on country and understand revenue and engagement performance at the country level:
- Click +Add filter.
- Select Secondary Dimension.
- Select Geo and then click Apply.
- Hover over the metrics below the time series to see the metrics breakdown based on geo. Countries are displayed by descending order of revenue generated.
UTM
Publishers that use UTMs filter based on that dimensions to understand performance at the article level and see which articles are generating the most revenue and engagement.
To filter based on country and understand revenue and engagement performance at the country level:
- Click +Add filter.
- Select Secondary Dimension.
- Select UTM and then click Apply.
- Hover over the metrics below the time series to see the metrics breakdown based on UTM parameters. UTMs are displayed by descending order of revenue generated.