Reporting
The metrics a publisher looks at are what tells them the story of their performance.
Reporting is Insight's landing page. It's organized into various sections but at the heart, are the 12 engagement and revenue KPIs that give a publisher the complete vision of their performance.
The following article presents all the information displayed on the reporting page and the different options that publishers have to manipulate and display the metrics.
For publishers that have more than one tenant Marfeelized (a tenant is a concrete domain that has activated the Marfeel solution), all tenants are aggregated on this page. There is the option however to filter the tenant displayed.
The message when you first log in denotes that daily revenues are subject to the time zone differences between ad networks and fluctuations in exchange rates. Click close (X) to close this message and prevent it from being shown again.
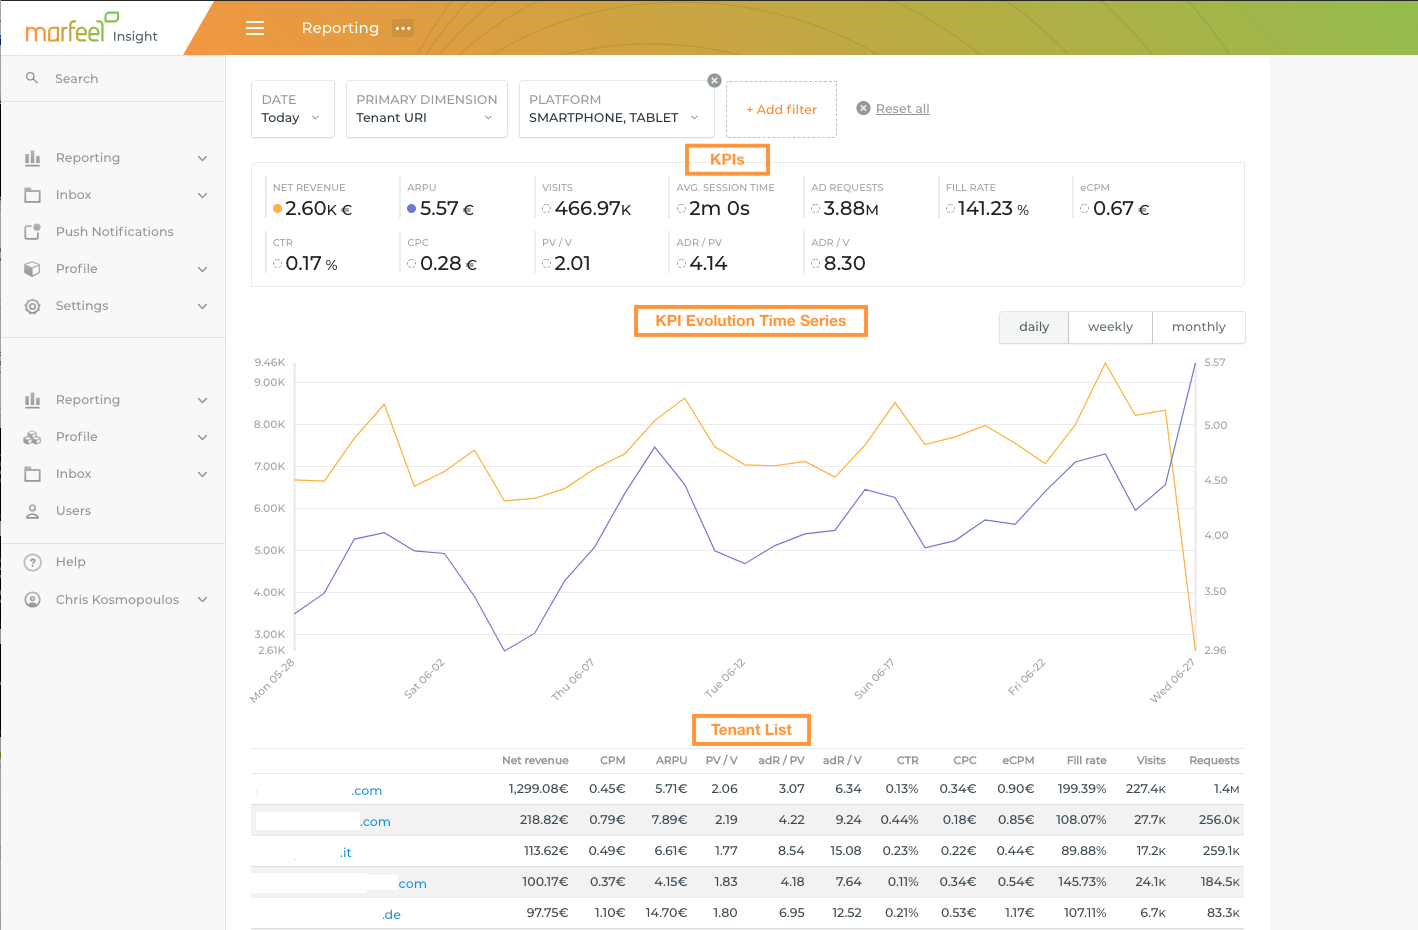
KPIs
The KPIs section on the Reporting page displays the 12 different analytics and revenue indicators for your Marfeel mobile site. For complete details of where the metrics come from and their value, see the Insight Revenue and Engagement KPIs article.
Below the main collective value for each KPI, the corresponding values for smartphone and tablet are also displayed.
KPI Evolution Time Series
The time series displays the evolution of the KPIs a publishers selected over time.
To display a specific KPI in the time series, click one of the values from the KPI section. Only 2 KPIs can be plotted at once as there are only two Y-axes.
Be sure to unselect the other KPIs in order to select new ones to display in the graphic.
KPIs for smartphone and tablet can also be displayed in the graph by clicking the respective values.
The KPIs you select to display in the graph are indicated with a color in the top left corner of their KPI space. The same color corresponds to that KPI's plot along the X-axis.
Time precision filters
Time precision filters are available in the upper right corner of the KPI evolution section. They allow publishers to reduce variance and remove low-frequency fluctuations to clearly see a trend.
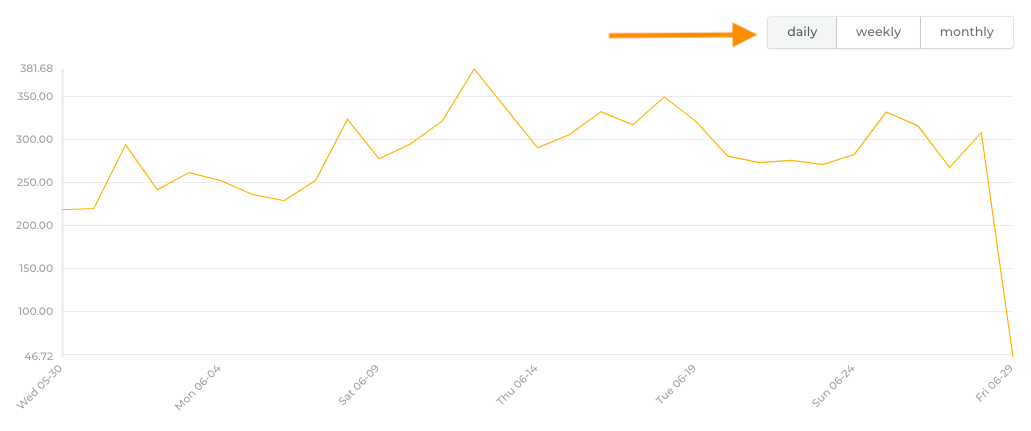
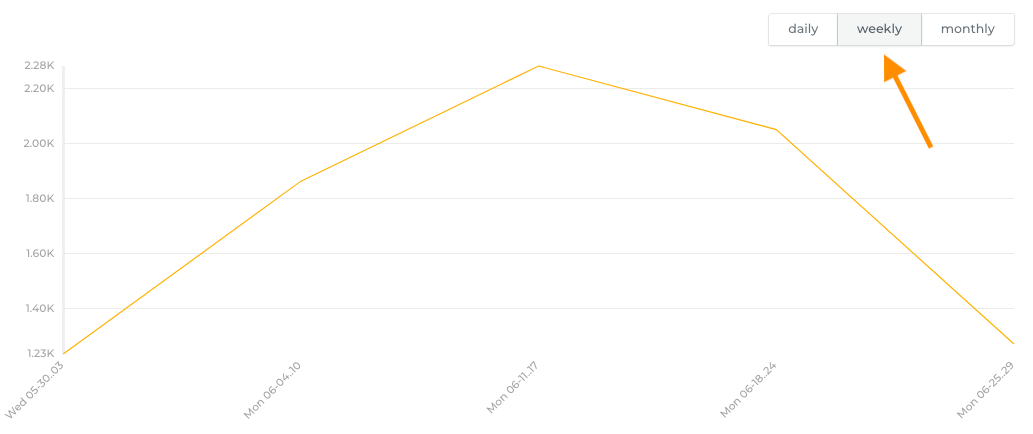
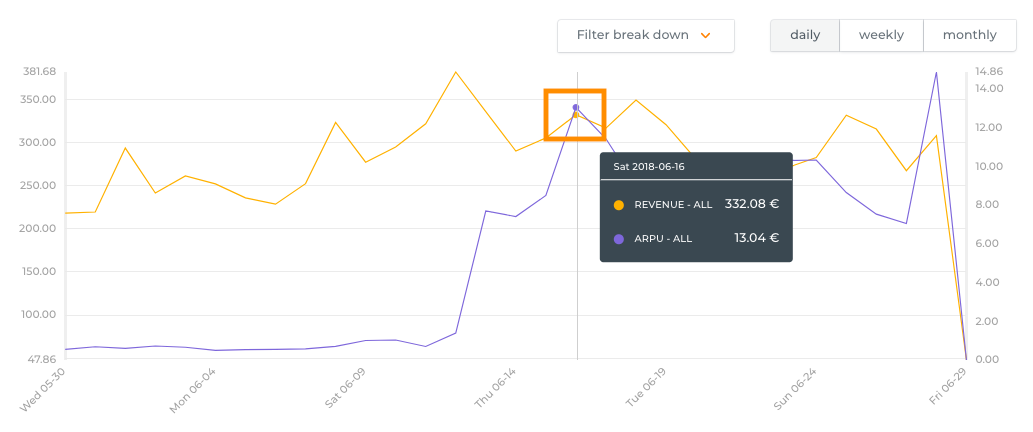
Hover over a graph to display the specific KPI figures for that day, week, or month when applying the corresponding time precision filter.
Tenants list
At the bottom of the Tenants Reporting page are the same 12 KPIs as in the top section, separated by each tenant a publisher has activated.
These KPI values can also be manipulated by applying tenant or time filter options.
Each tenant has two rows for each KPI. The top row displays the values for smartphones and the bottom for tablets.